
Daniel Avella Ordonez
Computer Systems Engineer
© 2026 All rights reserved.
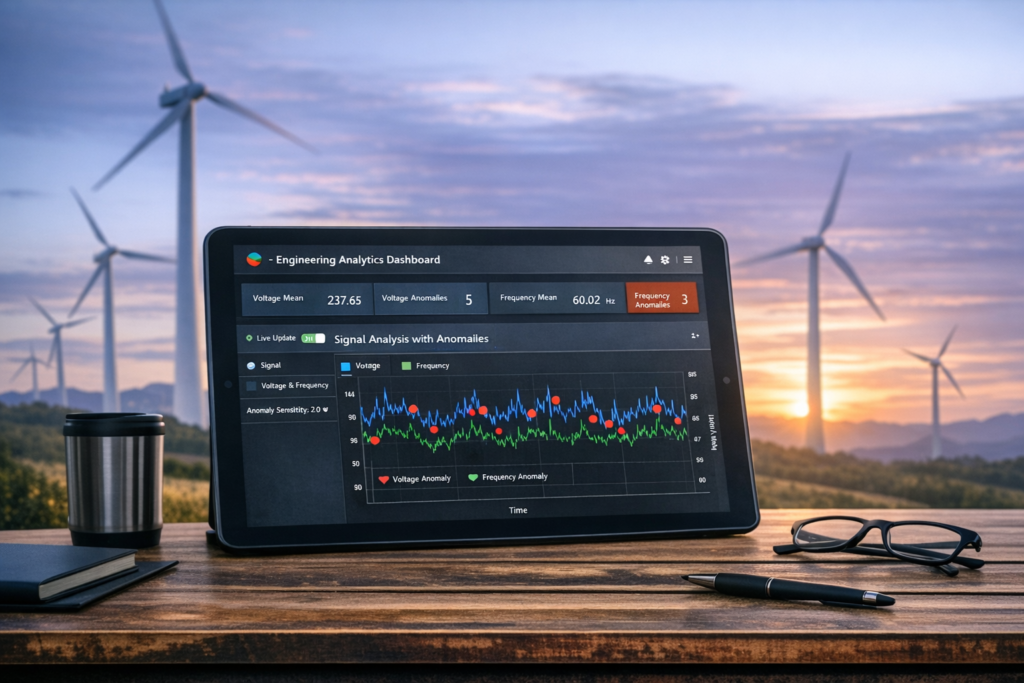
Engineering Signal Analytics Dashboard
Description
Personal
March 2026
An interactive engineering dashboard for real‑time analysis of voltage and frequency signals, featuring anomaly detection, statistical metrics, and dynamic visualization using Python and Streamlit.